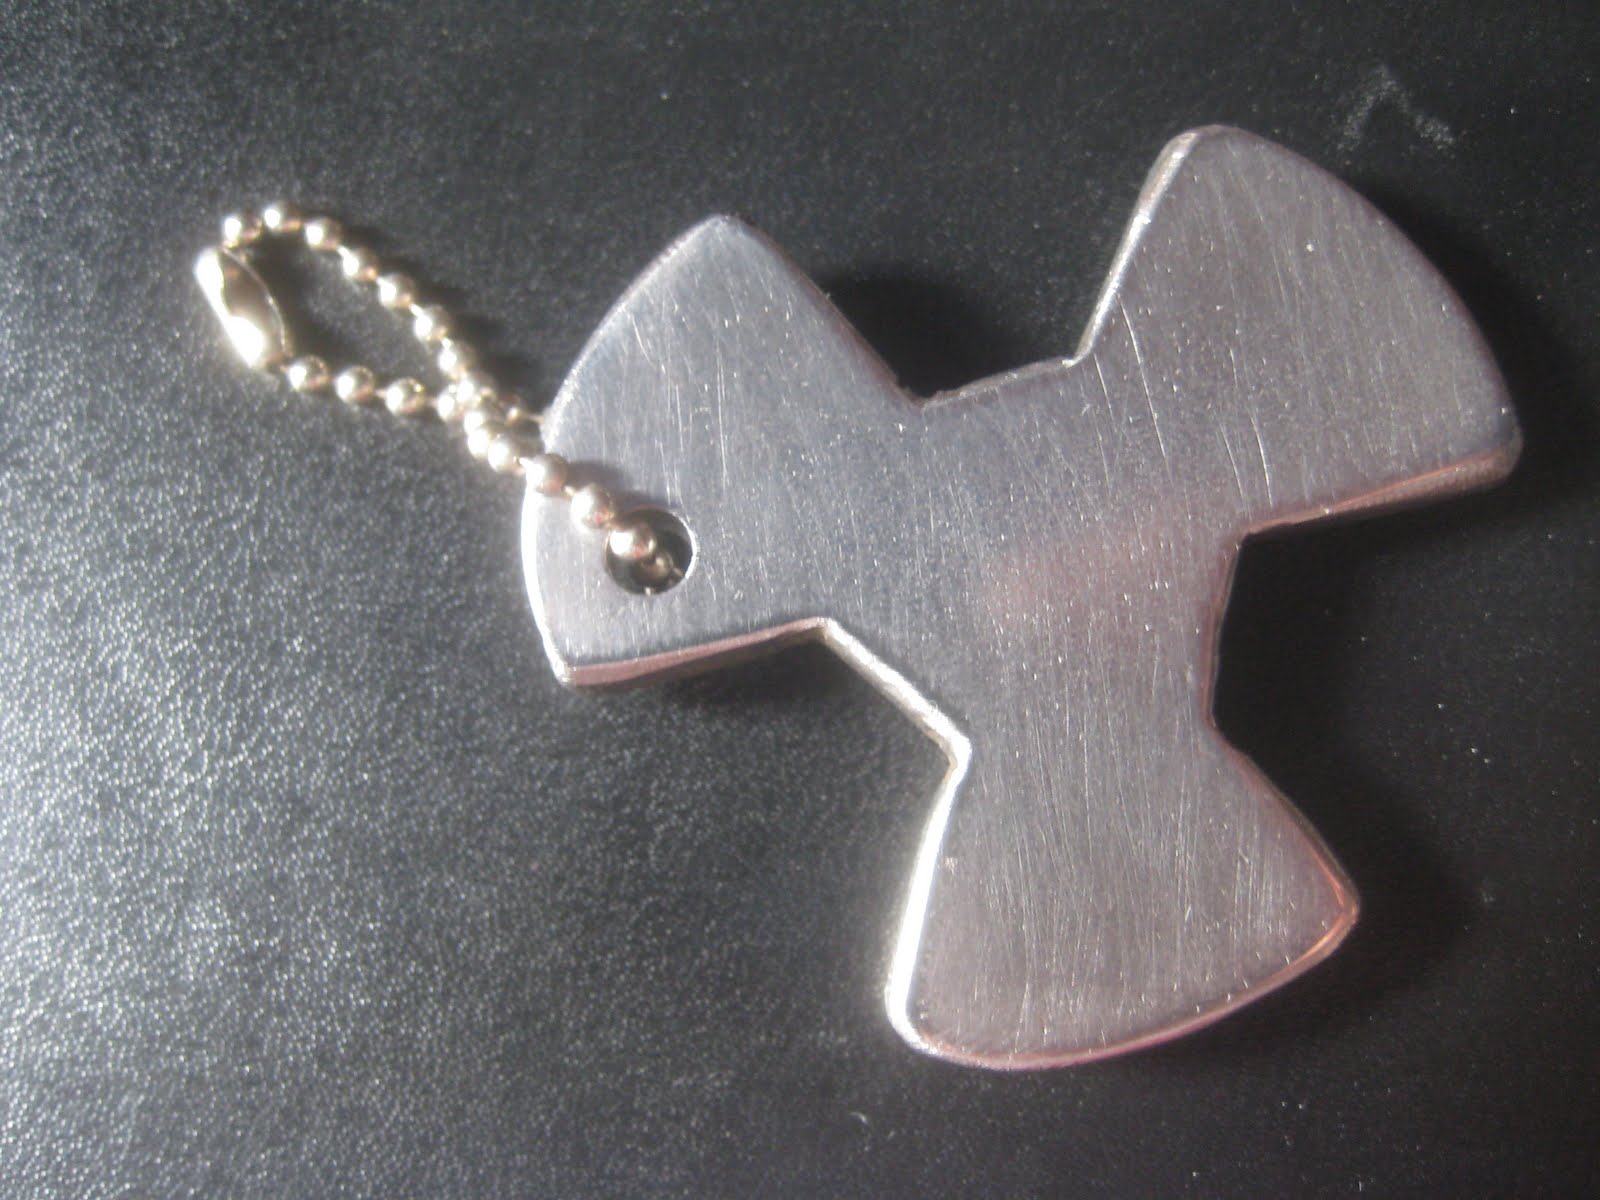
So I've had two more days of work in the metal workshop since I last showed my work, and it has advanced considerably.
I have now advanced from just the metal working lathe, I have now used both a milling machine (for straight machined cuts) and a Collet (a highly accurate lathe). So above are all my components so far, all of them are at the furthest stage I can take them at the moment, so in my mind I have done pretty well. The individual components are below.
Bolt x6 Tremmel Head x2
Extension Cap x1 Wheel holder? x1
Adjustment Wheel x1 Collet Cap x2
M5 threaded rod x1 Steel Point x2
Measureing Rod x1 Extension Rod x1
While all of the components will fit together to create a single tool, some of them are already made to fit and below are the different attachments so far.
Extention Rod and Cap and the Tremmel head, collet cap and Steel point
And the adjustment wheel and wheel holder.
So thats where I am at the moment, no more work on this till next week where we will be doing much more work on the milling machines.